Search latency
The search latency chart tracks response times at four percentiles: p75, p90, p95, and p99, measured in milliseconds.
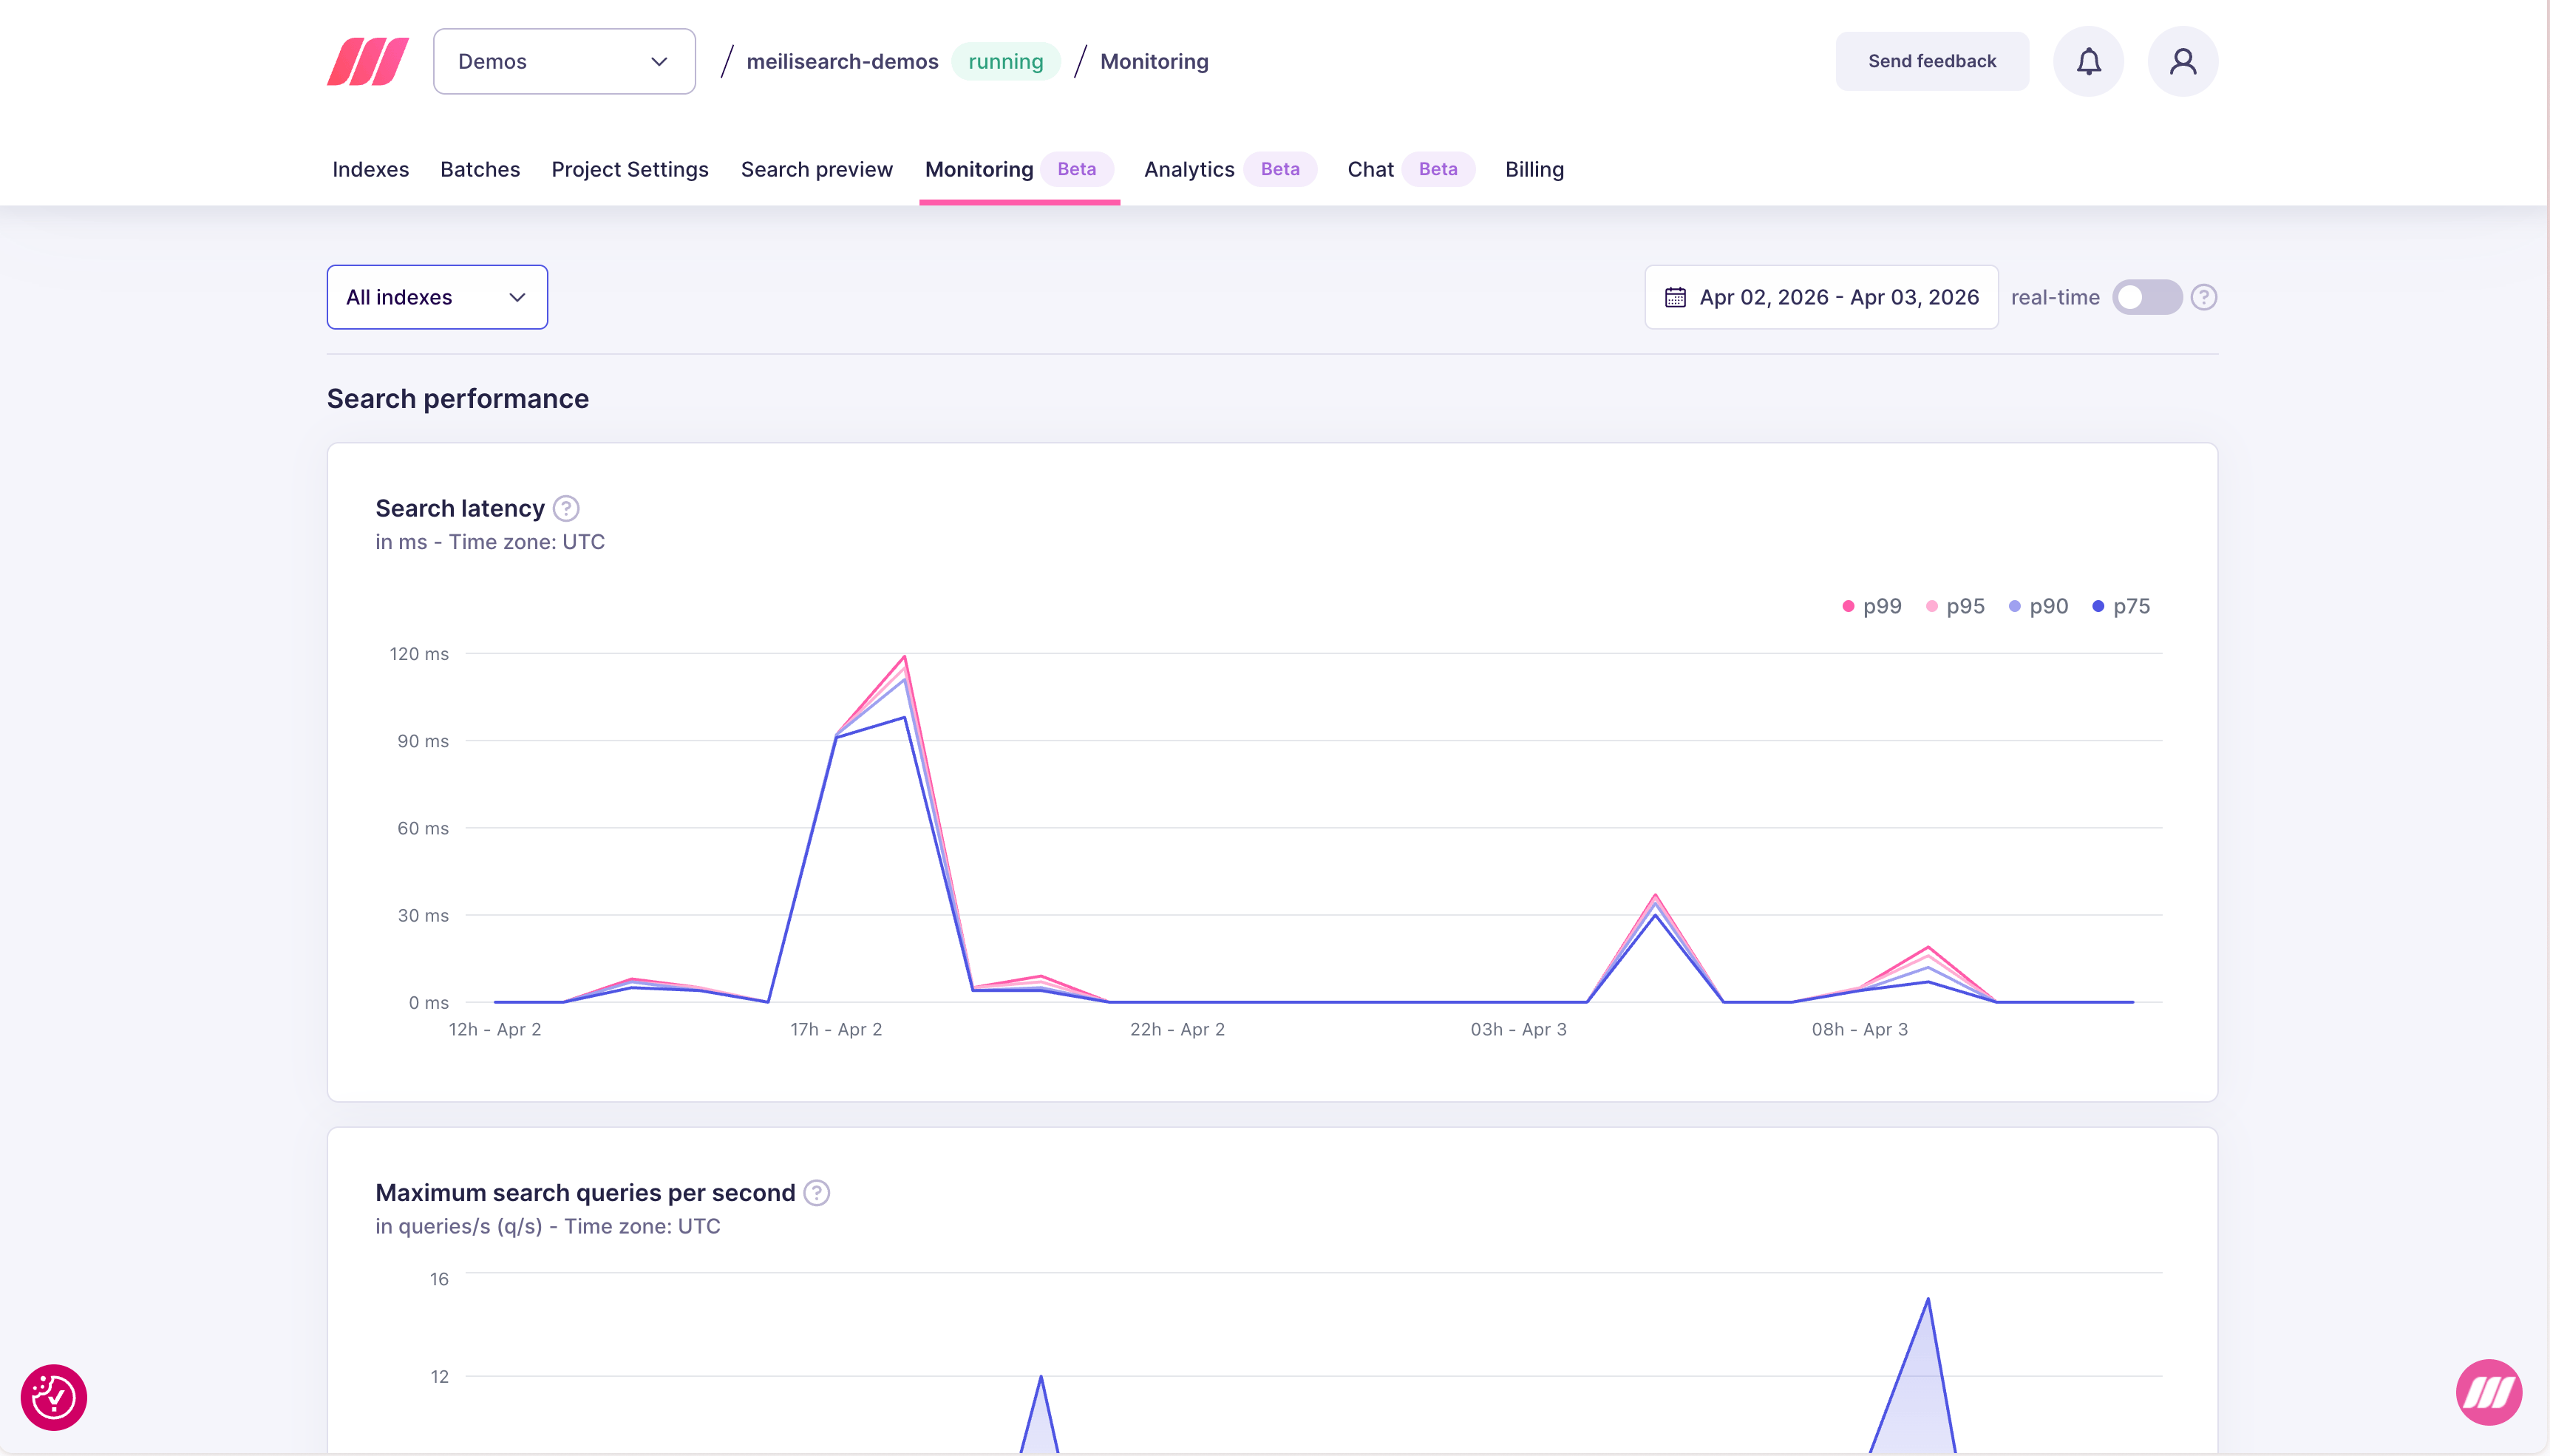
| Percentile | What it means |
|---|---|
| p75 | 75% of searches completed within this time |
| p90 | 90% of searches completed within this time |
| p95 | 95% of searches completed within this time |
| p99 | 99% of searches completed within this time — the slowest requests |
Maximum search queries per second
This chart shows the peak number of search requests processed per second (q/s) during each time interval.
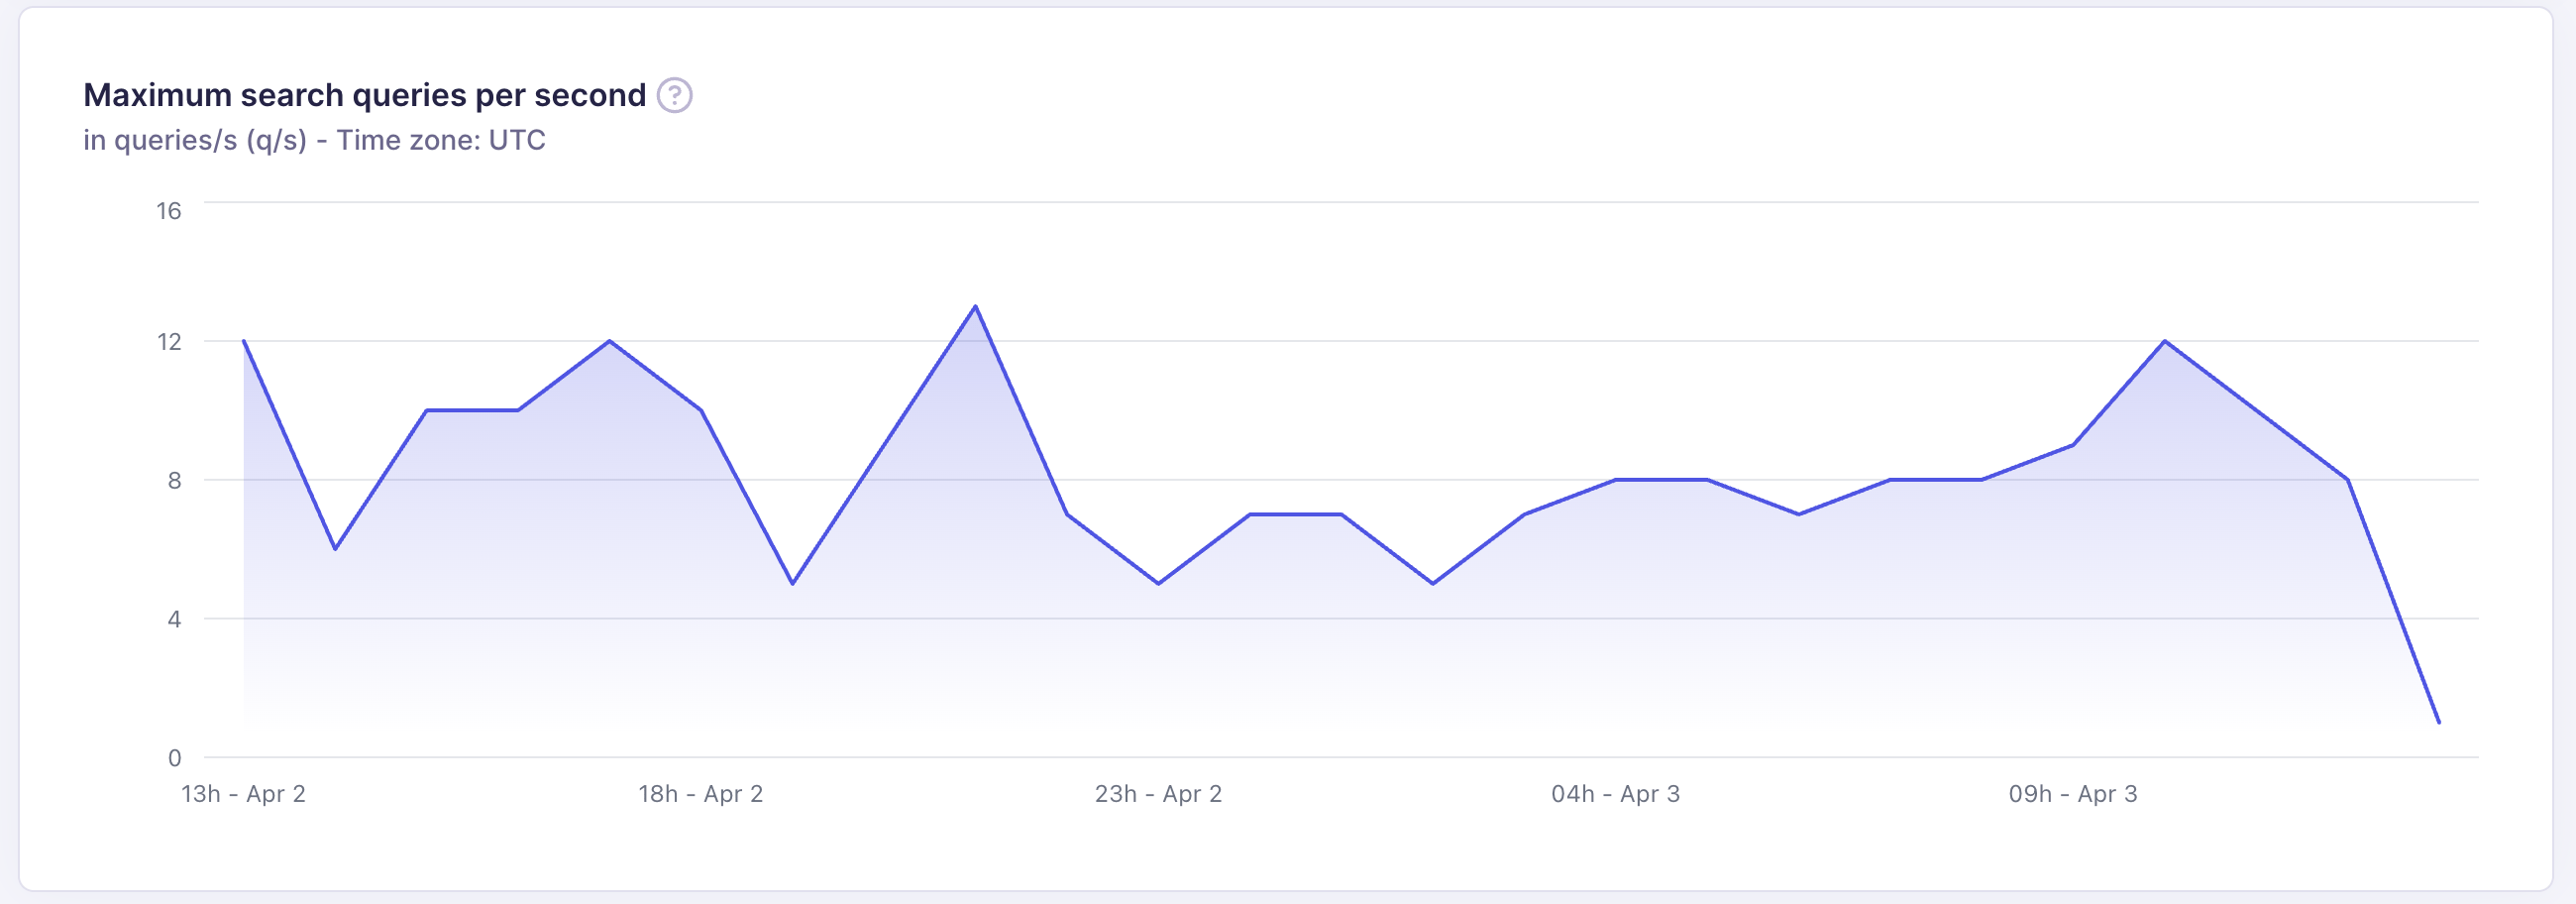
- Understand peak traffic patterns across the day or week
- Verify that your resource tier handles your traffic without latency degradation
- Detect unexpected traffic drops that may indicate application errors
Performance trace
Performance trace gives you a per-step breakdown of how time was spent during a search request. Use it to understand exactly where latency comes from, especially when your p99 is high but the cause is not obvious from aggregate metrics. To enable it, open the Search preview tab for your project and toggle Performance trace in the top-right of the results panel.
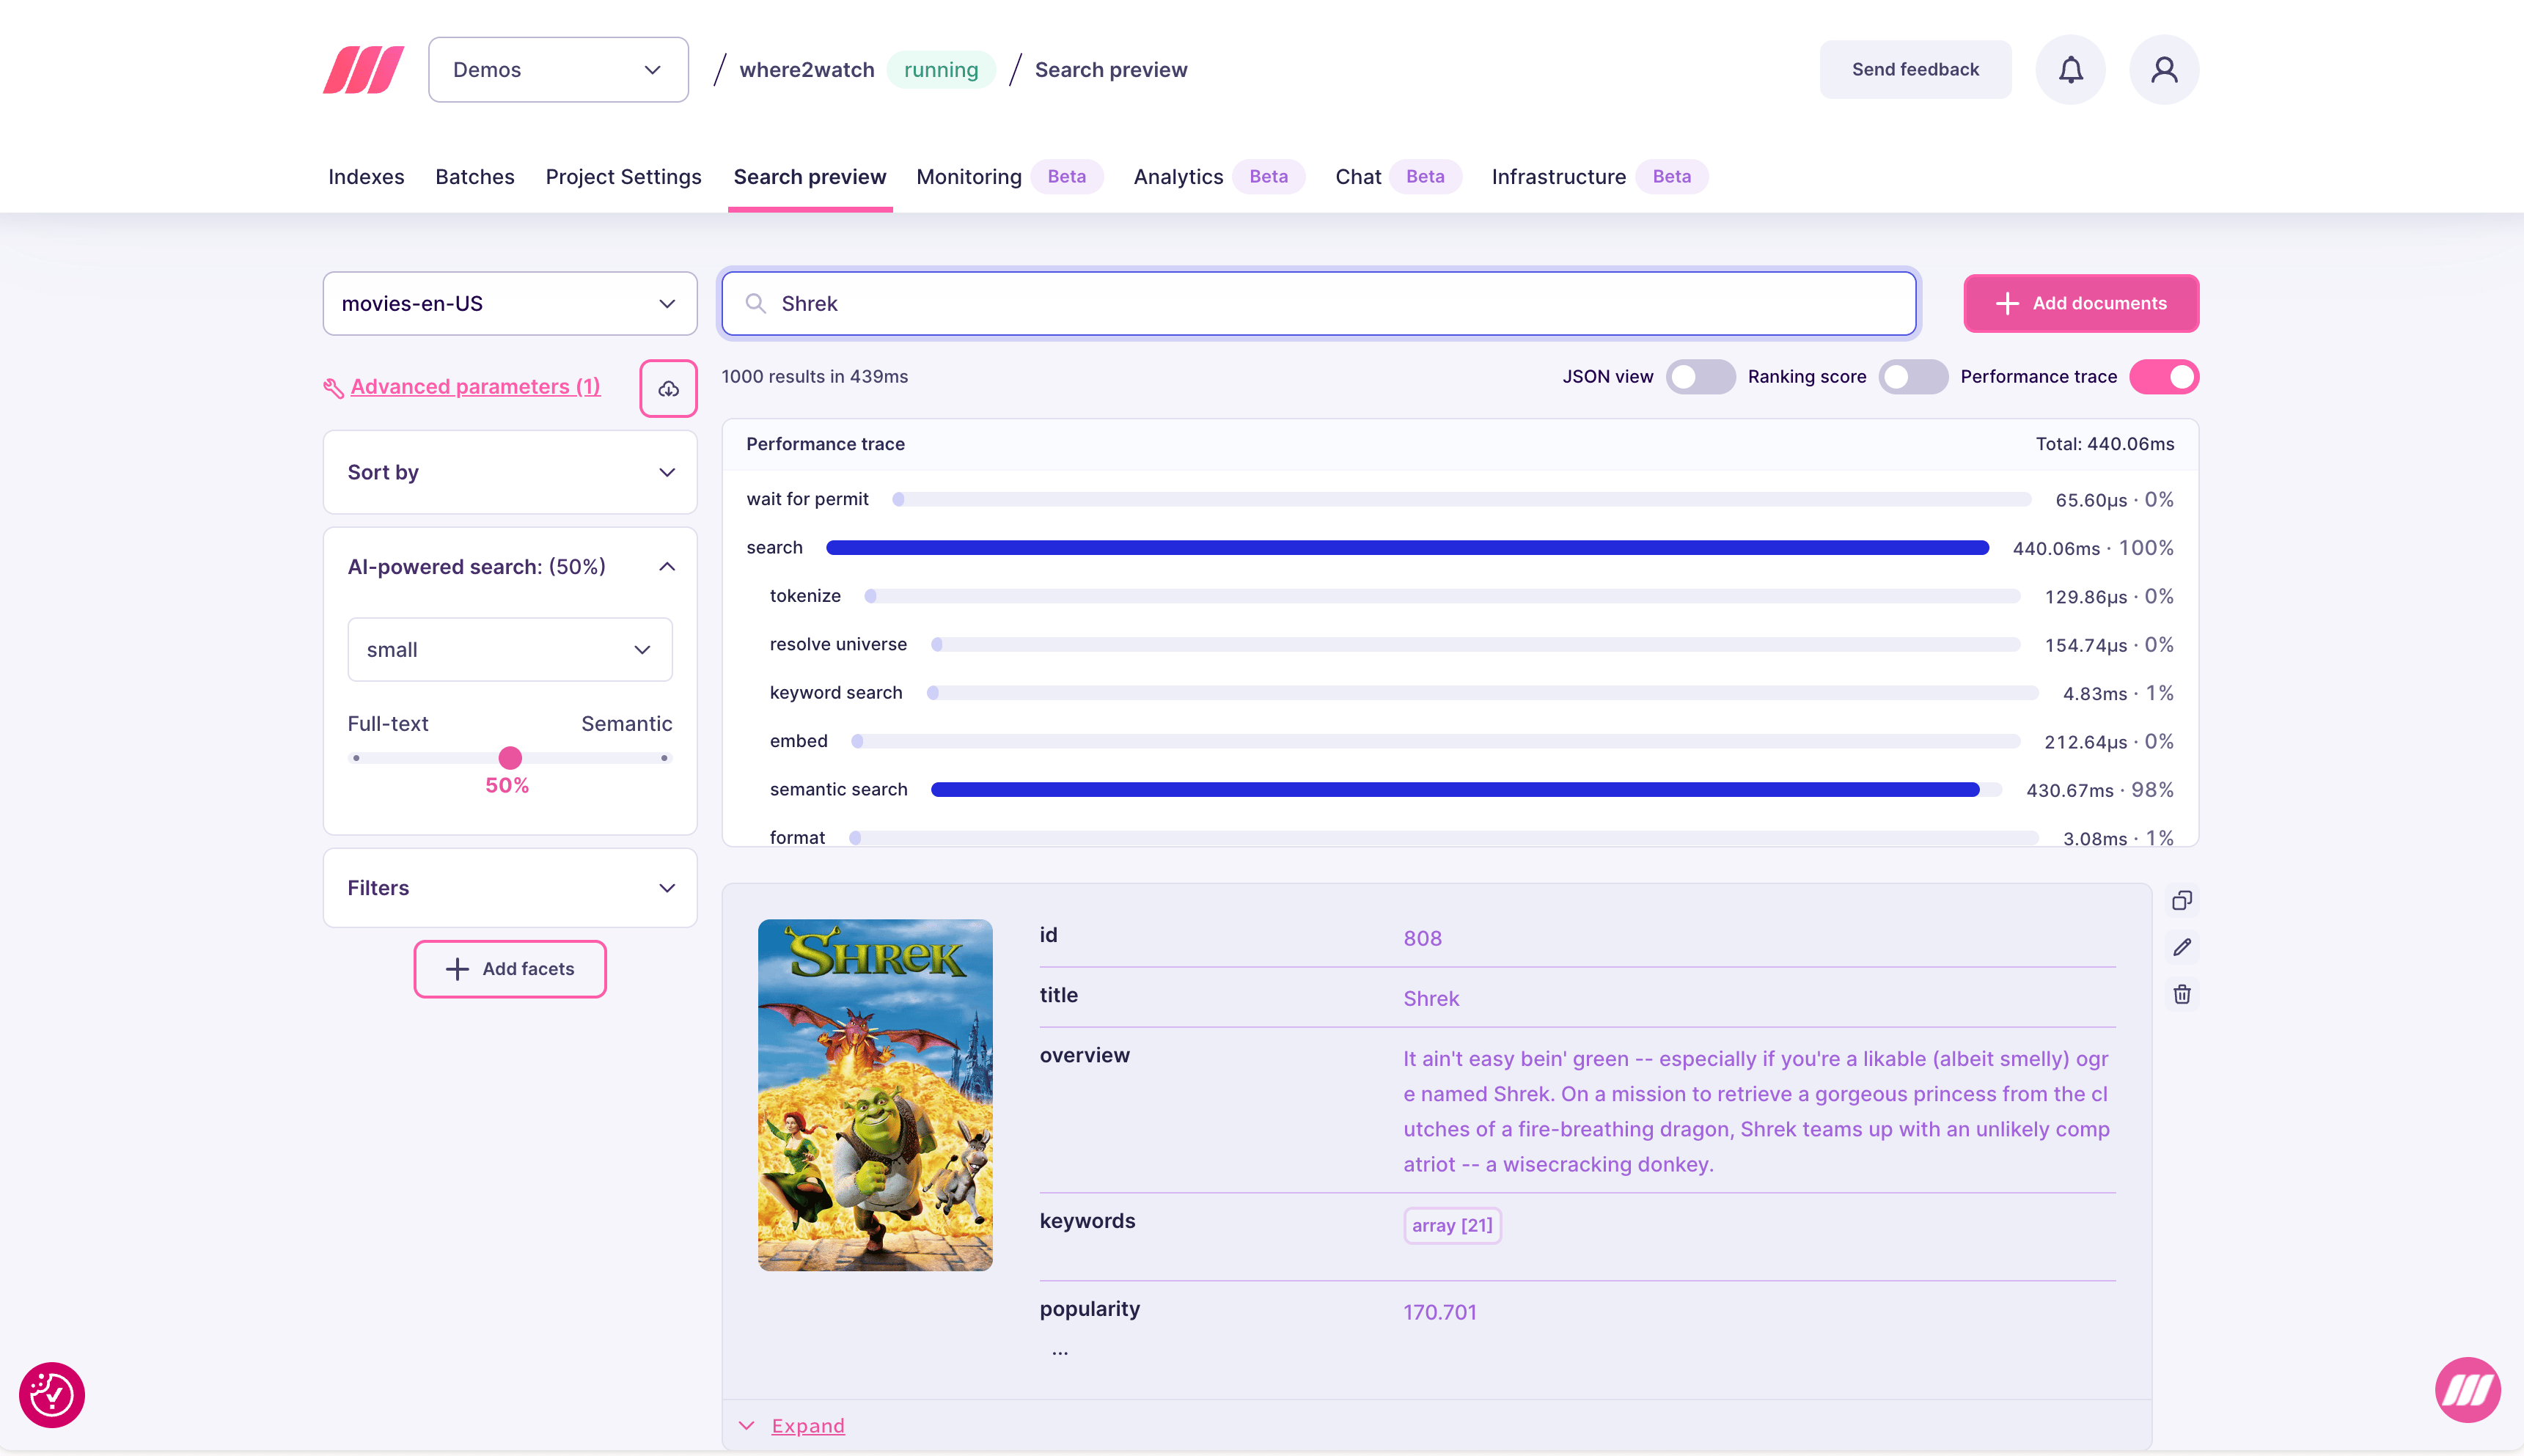
| Step | What it covers |
|---|---|
| wait for permit | Time waiting to acquire a read permit (queue wait) |
| search | Total time inside the search engine |
| tokenize | Query tokenization |
| resolve universe | Filter evaluation to compute the candidate document set |
| keyword search | Full-text ranking and scoring |
| embed | Time to generate the query vector (for hybrid/semantic search) |
| semantic search | Vector similarity search against the index |
| format | Formatting and serializing the response |
Expert support for Enterprise customers
In most cases, the simplest way to improve search performance is to upgrade to a larger resource tier. More RAM means more of the index fits in memory, which directly reduces latency. You can change your resource tier at any time from the project settings. If upgrading does not resolve the issue, the Meilisearch team can help. Enterprise customers have direct access to experts who can review your index configuration, query patterns, and performance traces to optimize for your specific workload. Contact sales@meilisearch.com to learn more.Common issues and fixes
| Symptom | Likely cause | Fix |
|---|---|---|
| High p99, normal p75 | Occasional complex queries or large result sets | Add pagination, reduce hitsPerPage, simplify filter expressions |
| All percentiles high | Index too large for available RAM | Upgrade resource plan |
| Latency spike after re-indexing | Settings change triggering re-ranking overhead | Monitor for a few minutes after settings changes; latency typically stabilizes |
| QPS drop without explanation | Application errors or expired API keys | Check application logs and verify API key validity |
High embed time in trace | Slow embedding model or cold model start | Switch to a faster embedder model or use a larger resource tier |
High semantic search time | Large vector index or high vector dimensions | Reduce vector dimensions, or upgrade RAM |
High resolve universe time | Complex filter expressions or many filterable attributes | Simplify filters; avoid filtering on high-cardinality attributes |