

Indexing latency (TTS)
The indexing latency chart tracks time-to-search (TTS): the time from when an indexing task is enqueued to when the indexed documents become searchable. Latency is shown at four percentiles, measured in milliseconds: p75, p90, p95, and p99.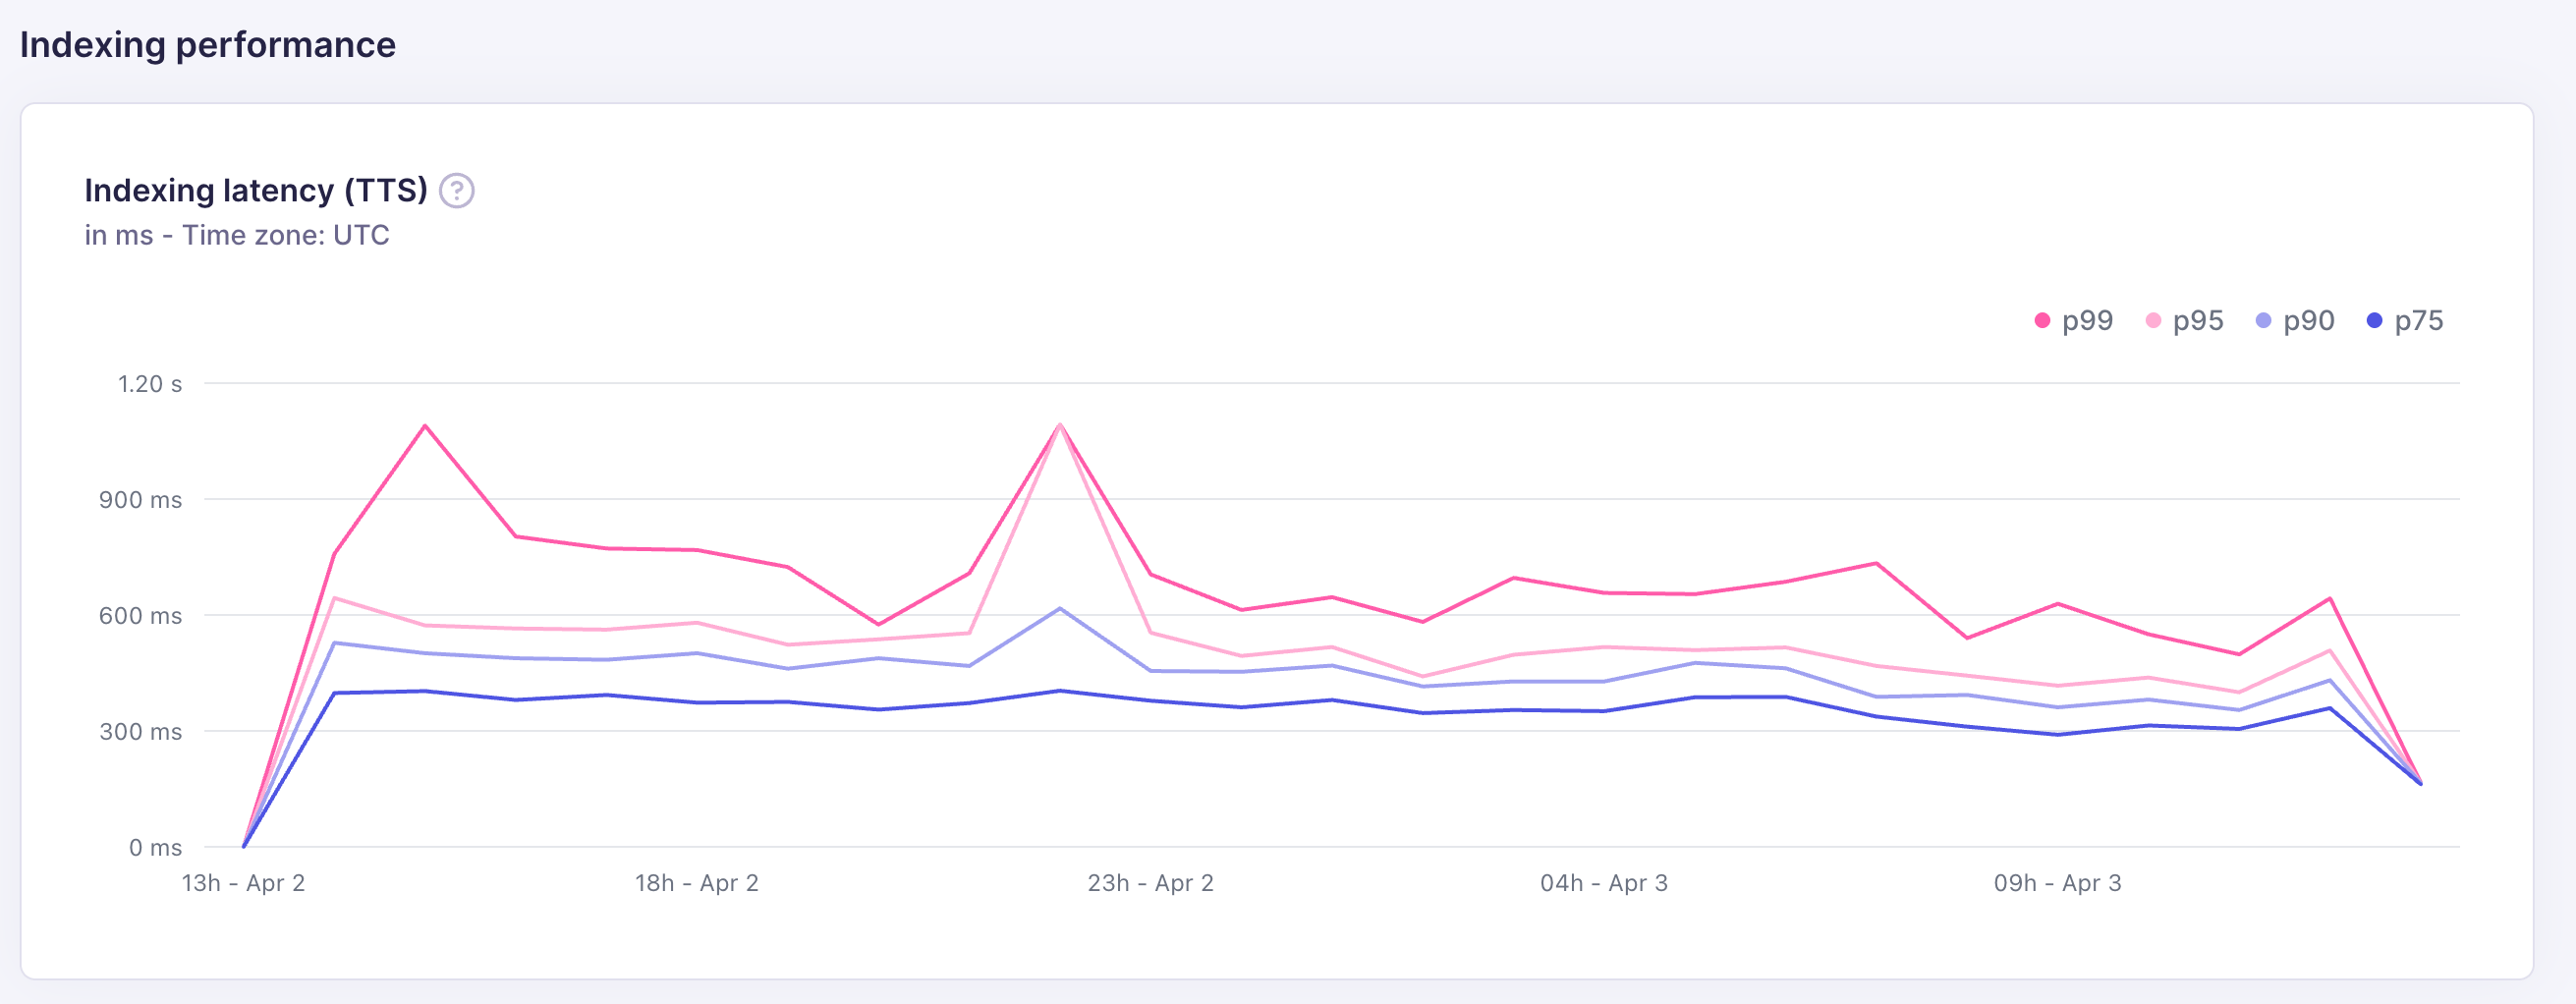
TTS is the metric that matters most for use cases where freshness is important, such as e-commerce catalog updates or live content indexing.
Batches
The Batches tab gives you a per-batch view of every indexing operation, along with a detailed trace of where time was spent. Use it when the TTS chart shows high latency and you need to identify the bottleneck.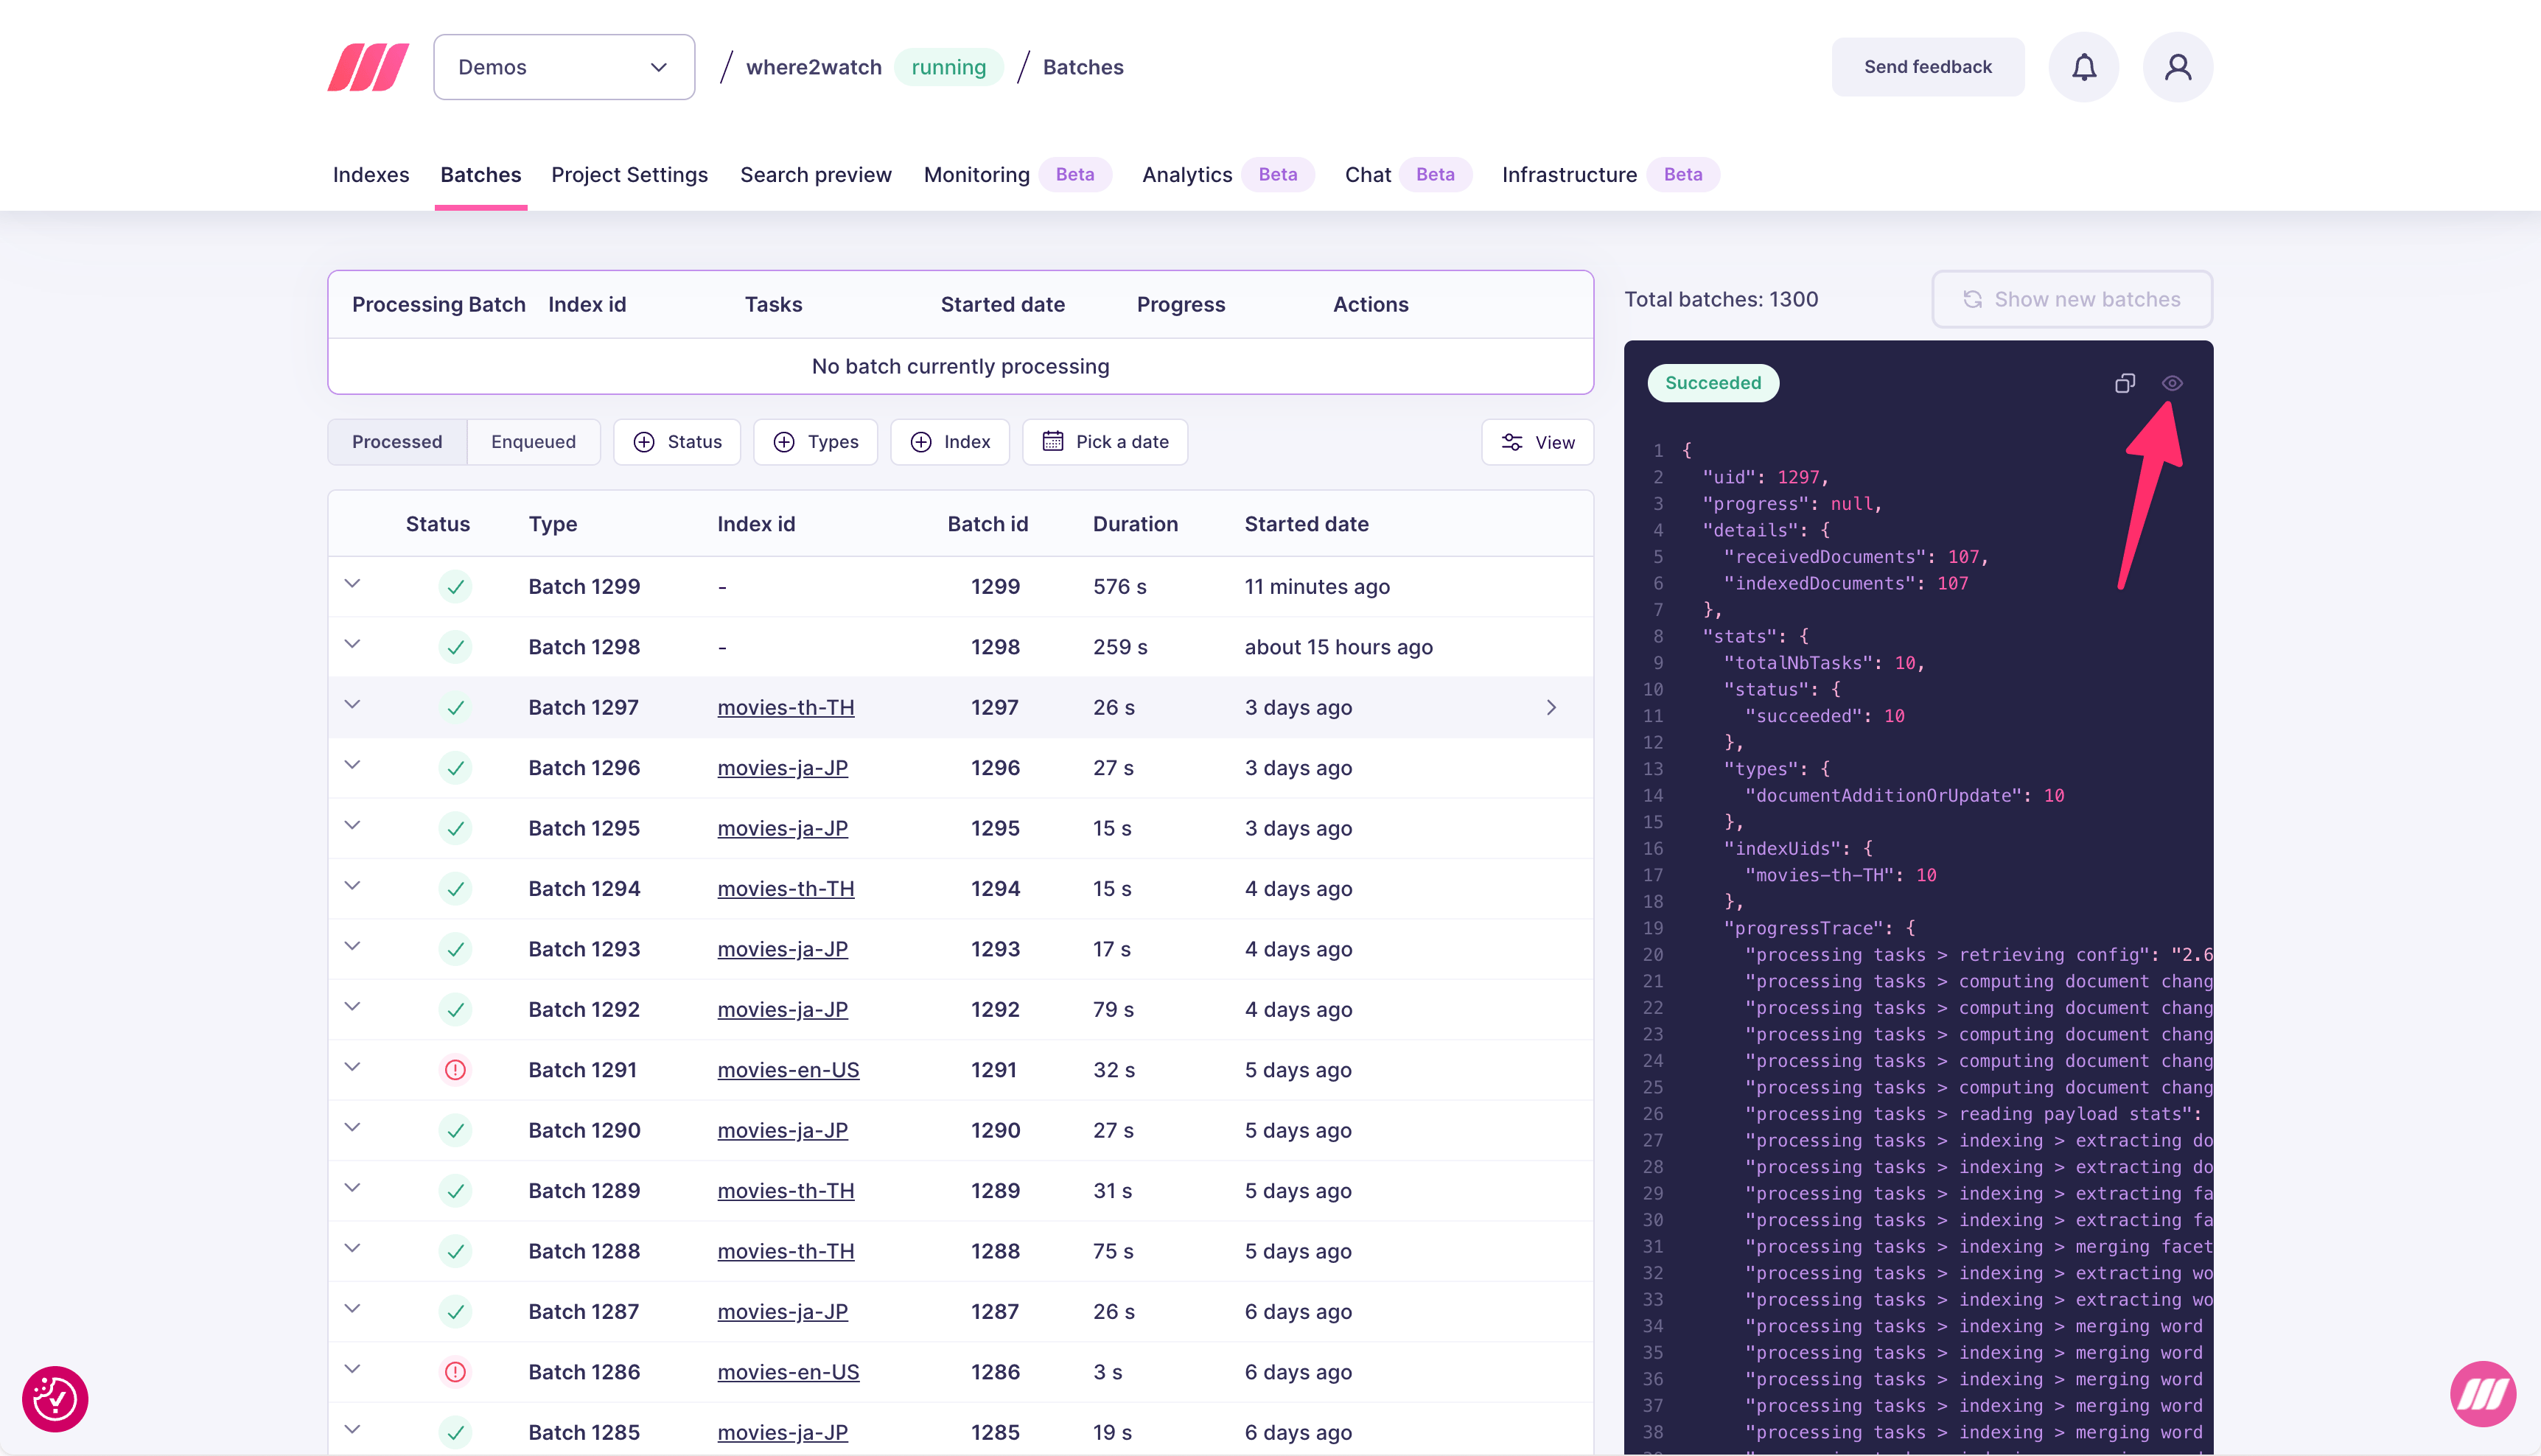
- Status: succeeded, failed, or in progress
- Index id: which index was written to
- Batch id: unique identifier for the batch
- Duration: total wall-clock time for the batch
- Started date: when the batch began processing
Progress trace
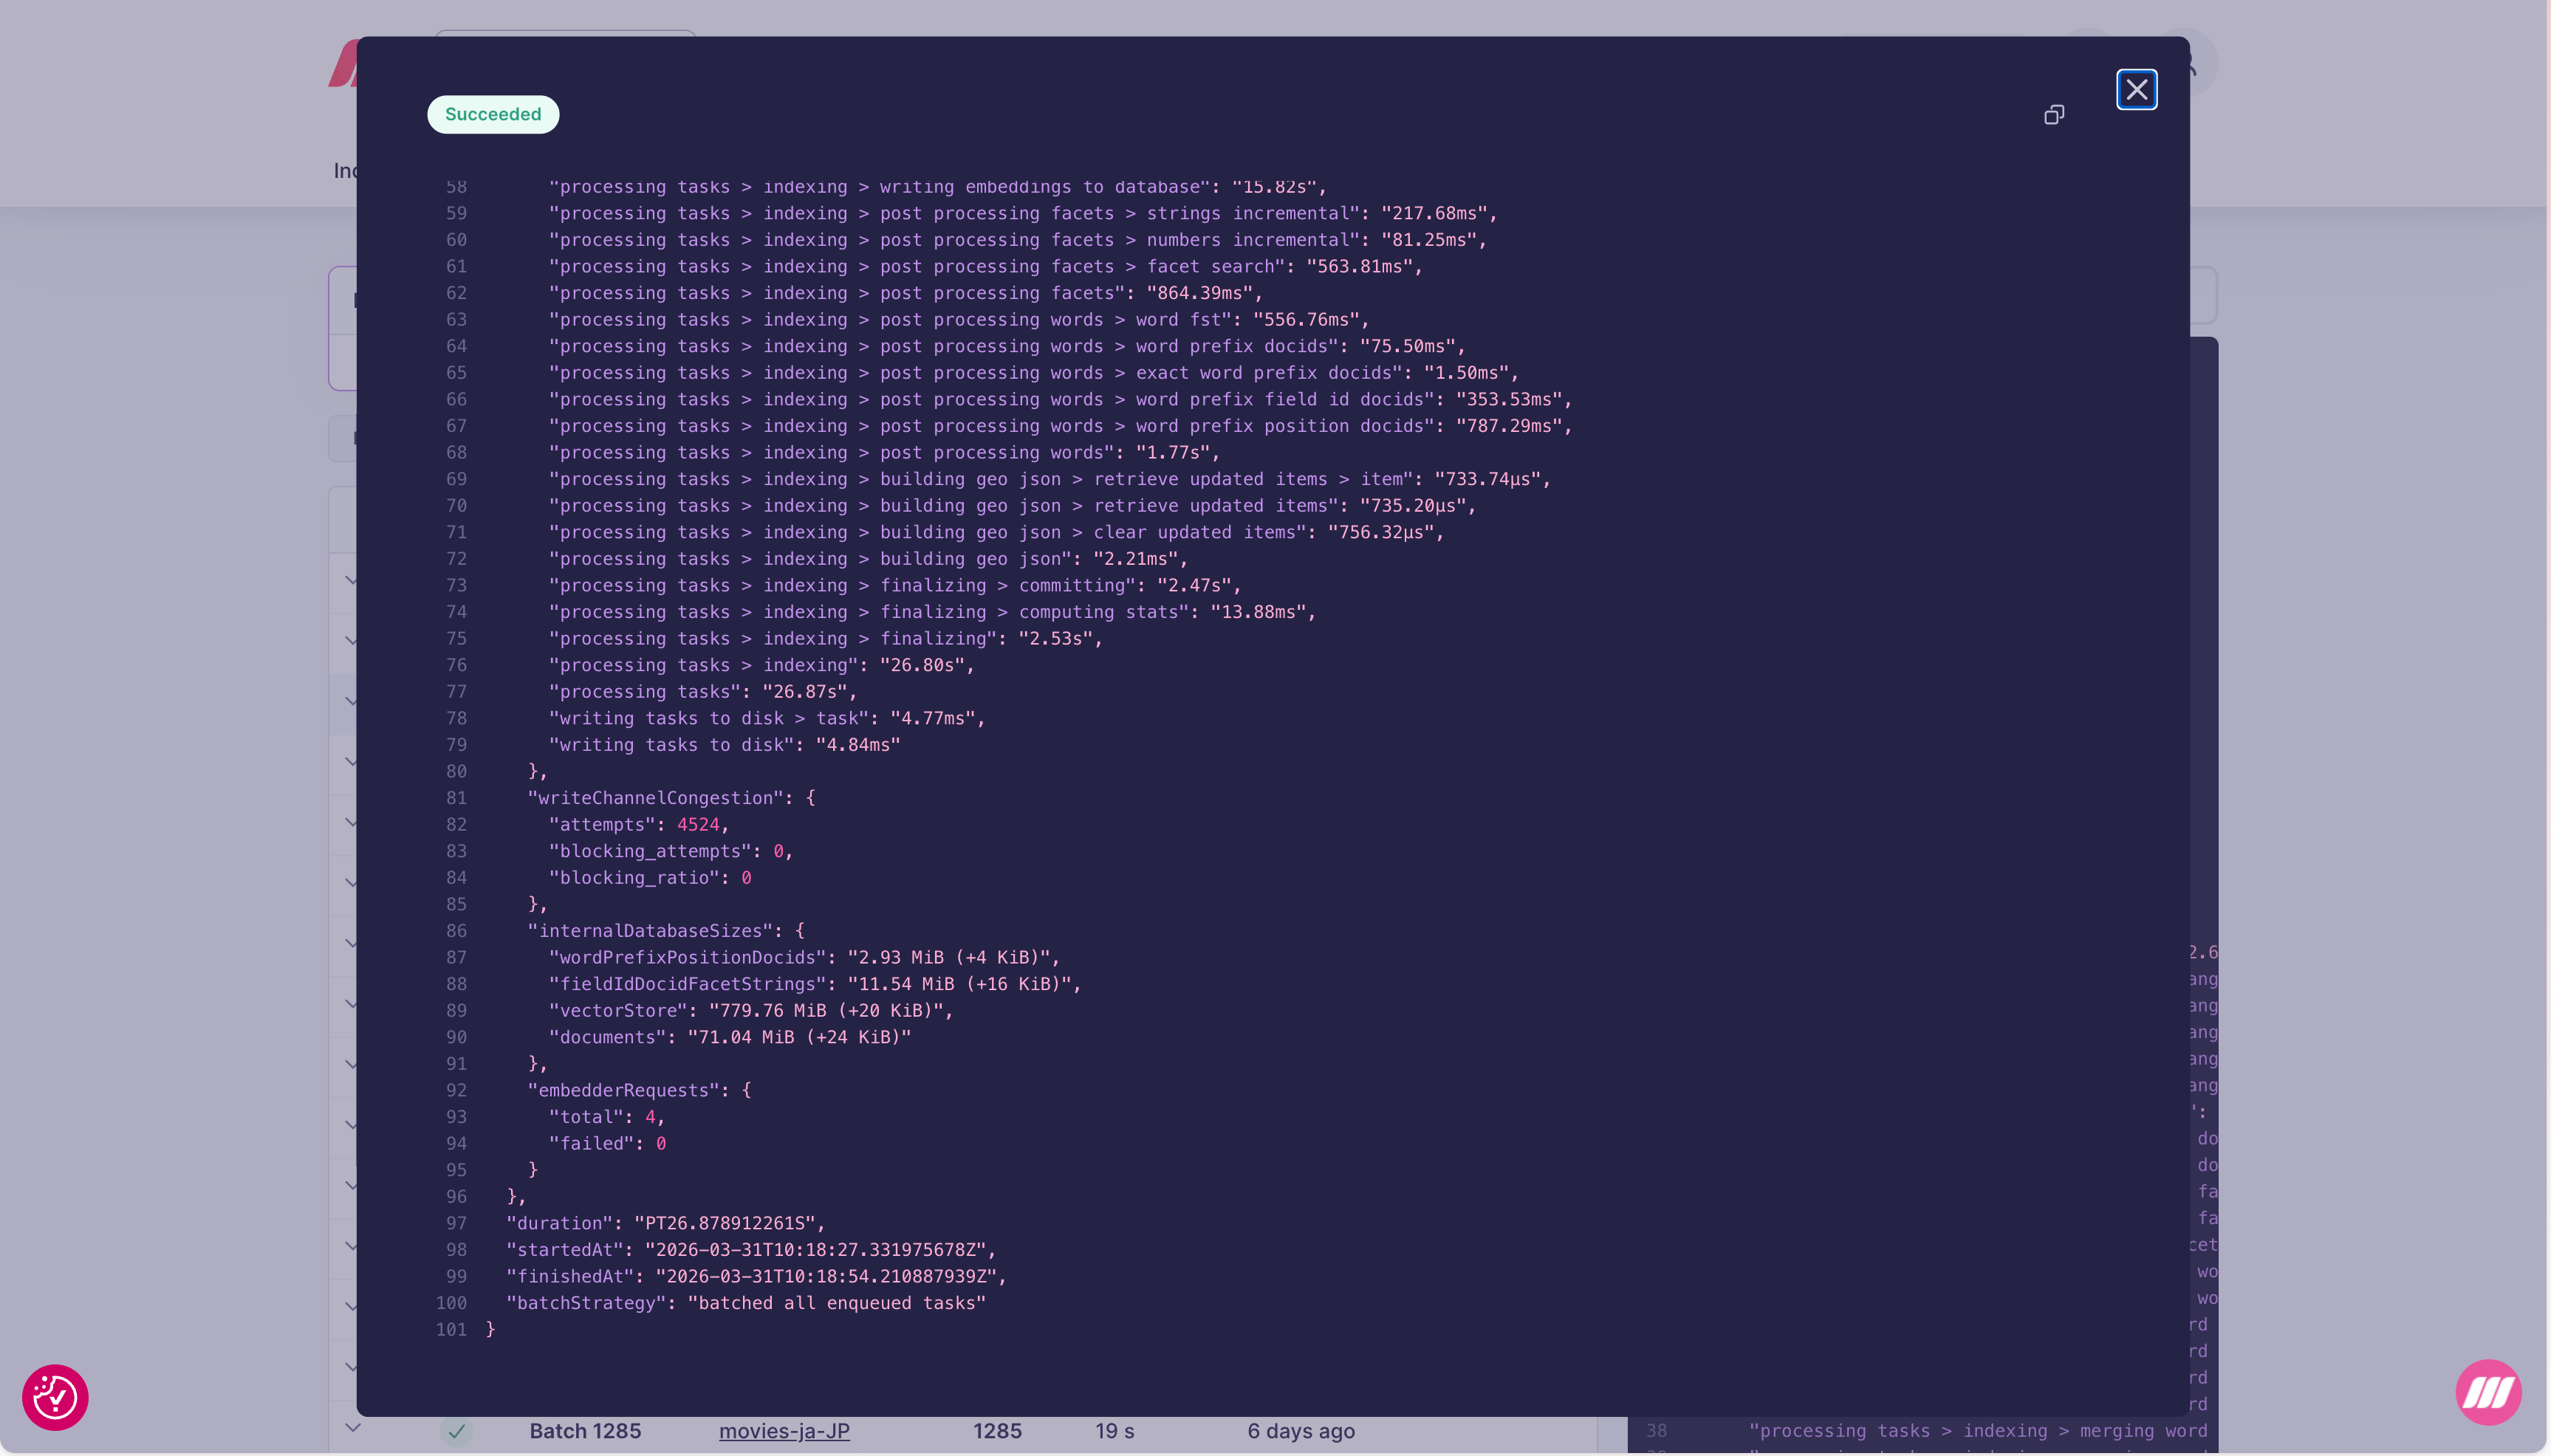
The details page includes aprogressTrace section with timing for every internal step of the indexing pipeline:
Internal database sizes
The Internal DB table shows the current on-disk size of each internal data structure, along with the delta from this batch:
The delta (shown as
+N KiB or +N MiB) tells you how much space each batch adds. A vectorStore growing much faster than documents indicates a high-dimensional embedding model.
Fetch internal sizes from the API
The same breakdown is available outside the dashboard. PassshowInternalDatabaseSizes=true to either stats route to add an internalDatabaseSizes object to the response, and sizeFormat=human to receive readable strings such as 19.64 MiB instead of raw byte counts:
GET /indexes/{index_uid}/stats and GET /stats. sizeFormat defaults to raw, which reports every size in the response as a number of bytes. Internal database names can change between Meilisearch versions, so treat this breakdown as diagnostic output rather than a stable contract.